The economy is showing some great news and some heartburn. With misinformation from a variety of sources showing up across the media spectrum, where can one turn for an accurate economic vision? The Federal Reserve Economic Database, commonly called the FRED, is like eating a superfood with antioxidants, or whatever recent fad is out there, for your media diet. Hosted by the Federal Reserve Bank of St. Louis, this database is easily accessible and shows decades of trends.
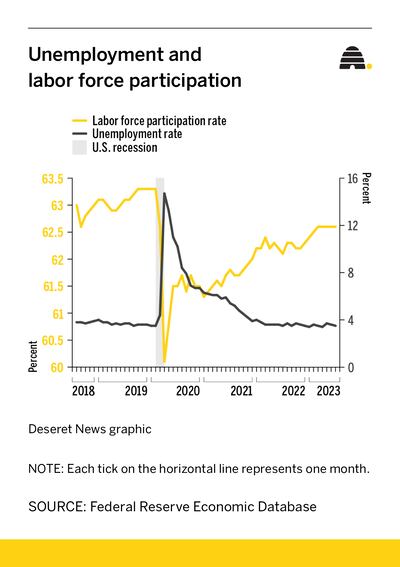
First, in consultation with FRED, let’s consider the labor market. The two key indicators are the unemployment rate and labor force participation rate (the percentage of prime age workers employed or actively searching for work).
Looking at the data from the past five years, we can see a remarkable drop in labor force participation followed by a steady increase back to 2019 levels. Conversely, the unemployment rate dramatically spiked to levels not seen since the Great Depression, decreased to 2008 recession levels in January 2021, and then steadily decreased to levels that are below what most economists would consider “full employment.”

This news is fantastic for workers who are starting to see job opportunities at higher wages, as well as increased bargaining power with their employers. However, this news is difficult for business owners who are having a tough time finding workers and seeing labor costs cut into already slim profit margins. With labor force participation returning to pre-pandemic levels and unemployment still very low, employers are finding themselves in a bind.
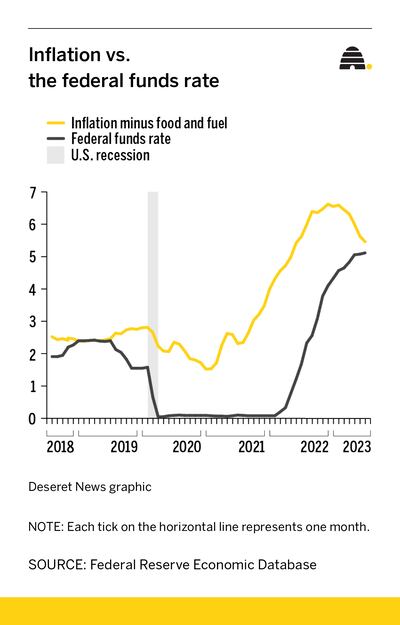
Now, let’s look at inflation, which has been top of mind for everyone. One basic economic tradeoff is between higher unemployment for lower inflation and vice versa. In the worse part of the pandemic, the Federal Reserve and Congress chose to focus on staving off a collapsing labor market at the cost of higher prices. With the rapid availability of vaccines and other ways to deal with the virus, this stimulus pushed the labor market beyond full employment and inflation soared, in contrast with the 1970s stagflation — both high unemployment and inflation.
In response, the Federal Reserve began pulling money out of the economy by selling treasury bonds on its balance sheet for cash, causing interest rates (mainly the Federal Funds Rate) to spike and prices to drop rapidly; so rapidly that the most recent measure of around 3.5% (year-to-year change) hasn’t even made it into the FRED’s most recent graph. While the trend is encouraging, inflation is still significantly above the Fed’s target of 2% and represents a slowing of price increases, not an overall drop.

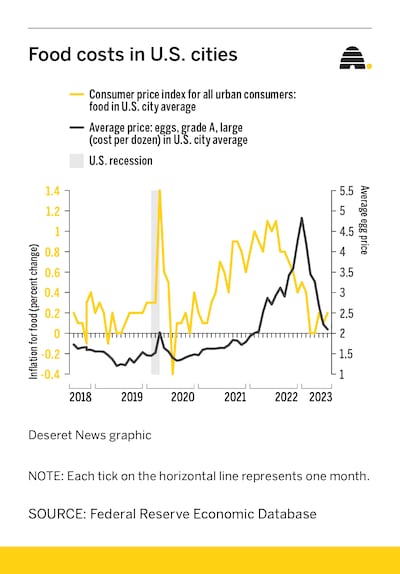
With jobs everywhere and inflation declining, why are consumers still pessimistic? One reason is that economists tend to leave out food and energy when calculating core inflation because these prices tend to swing sharply given supply and demand shocks that are independent of the amount of money in the economy. And food prices have remained stubbornly high.
One reason is bad luck (a disease in poultry that wiped out the supply of eggs) and labor shortages exacerbated by the pandemic and immigration issues. However, these prices changes have begun to slow, and I no longer need a second mortgage to make an omelette. You can see the change in this graph displaying month-to-month food price change and the average egg price.

Still, food and gas prices are higher than they were three years ago, and while economists may not believe these prices contribute to core inflation, they still hurt Main Street in the pocketbook.
The New York Fed recently reported that household credit card debt is on the rise. This indicator is helpful but murky. Consumers could be making more big-ticket purchases, reflecting optimism, or they could be putting more everyday bills on their cards. While delinquency has edged up, it’s nowhere near the doldrums of the 2008 recession. Keep an eye on this trend as it may bring more clarity for future consumer sentiment.
Meanwhile, higher interest rates are making homes even more unaffordable. Having recently moved, I have felt that pain personally, although my parents quickly reminded me of their double-digit interest rate from the early 1980s. Generally, higher interest rates suppress home prices, but given short-sighted zoning laws and the unwillingness of home buyers to swap their low fixed rates from 2020 for today’s rates, supply is extremely tight and so prices remain high.
Overall, the data from FRED show an economy that is starting to return to normalcy. The Fed will most likely push rates up to continue to get inflation down, but (fingers crossed) the worst is probably behind us. Policymakers could help the recovery by considering immigration reform to address worker shortages (especially in agriculture), fiscal restraint to avoid higher debt and future interest payments, and reforms to zoning laws to aid in housing construction. But with an election coming up, the old adage rings true, “In God we trust, all others bring data”.
Michael S. Kofoed, @mikekofoed on X, is an assistant professor of economics at the University of Tennessee at Knoxville and a research fellow at the Institute of Labor Economics. A Utah native, he holds degrees in economics from Weber State University and the University of Georgia.

